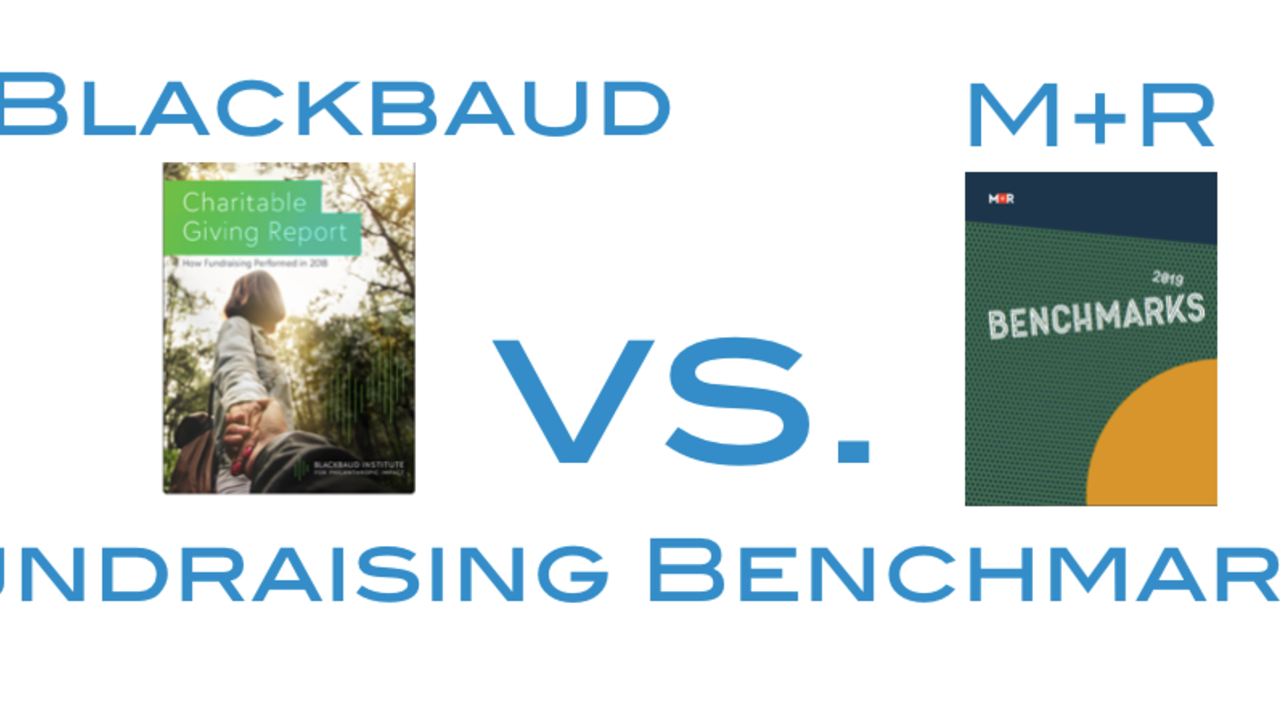
Comparing 2018 Digital Fundraising Benchmarks (Blackbaud vs. M+R)
Apr 30, 2019Nonprofit leaders wear many hats. It’s quite the balance of pleasing many audiences, which includes donors, employees, community leaders, and those needing services (which is why the nonprofit exists in the first place). From a fundraising perspective, it involves keeping an eye on planned giving, major donors, and ROI from all fundraising efforts. Many critical investment decisions have to be made that can enhance or takeaway from the impact your nonprofit can make towards its mission. Every dollar counts. With that, the age old question pops up throughout the year: “How are we doing compared to other nonprofits?”
As a digital fundraiser, two reports I eagerly await each year are the Blackbaud Charitable Giving Report and the M+R Benchmarks Report. Both are available here and here. Both offer a trove of information that are useful in helping gauge your own organization’s digital fundraising efforts. Within the most recent release of each of these reports, you’ll find some similarities and differences that both provide valuable information to your nonprofit. Let’s take a look at the following comparison between reports:
Data Set
First, it’s important to know that the data sets for each report is substantially different. For its online fundraising data, Blackbaud includes 5,537 organizations that generated $2.7 billion in online revenue, and M+R includes 135 organizations that generated $377 million in online revenue. The data set size difference is due to how each company procures the data for its reports. Blackbaud has access to data from its nonprofit clients (which is a ton) that use Blackbaud’s suite of technology services. M+R provides marketing and fundraising services to nonprofits, following an agency model, and procures data from nonprofits that volunteer to share their information.
How Nonprofit Size is Defined
Blackbaud and M+R both define small, medium, and large nonprofits differently in the reports. This is worth paying attention to, especially if you are looking for more relevant benchmarks to nonprofits that are closer in size to yours. They both categorize nonprofit size based on the amount of online revenue generated. Here’s the breakdown for each:
Blackbaud
· Small: Less than $1 million annual online revenue
· Medium: $1 million to $10 million
· Large: $10 million +
M+R
· Small: below $500 thousand annual online revenue
· Medium: $500 thousand to $3 million
· Large: $3 million +
Comparable Fundraising Benchmarks
A few benchmarks appear in both reports. It’s interesting to see the difference in data points like average gift or retention rates. As you see the difference in benchmarks for the same metric, like mobile giving, you hopefully recognize the importance of not hanging your organization’s performance on a single industry benchmark and declaring a success or failure in your own efforts. Here are four benchmarks shared between both reports:
1. Average online donation
· Blackbaud: $147
· M+R: $106 (although, this report says this is the average one-time gift)
2. First year, online-only donor retention:
· Blackbaud: 22%
· M+R: 25%
3. Multi-year, online-only donor retention:
· Blackbaud: 64%
· M+R: 59%
4. Percent of online gifts that are made through mobile devices:
· Blackbaud: 24%
· M+R: 30%
Differences Between the Reports
Aside from a few metrics that appear in both reports, each highlights different facets of digital fundraising that are quite insightful. The biggest difference between the reports is that M+R provides a comprehensive view of multiple digital channels, while Blackbaud focuses more on the bigger online fundraising picture. Here are a few of the unique online fundraising categories of information shared within each report:
Blackbaud Charitable Giving Report
o International giving trends summary
o Giving Tuesday giving trends
o Giving trends by month
o Overall fundraising vs. online fundraising trends
M+R Benchmark Report
o Facebook Fundraiser data (new for 2019)
o Email metrics
o Monthly giving metrics
o Membership and ticket revenue data
o Digital advertising metrics (display, search, social media, video)
o Donation page conversion metrics
o Text messaging metrics
What Do I Do With This Information?
As a consultant, I often get asked by nonprofit’s “What’s a good email open rate?” or “What’s the industry standard for an average digital gift?” Well, you’ll get those answers and more between both of these reports. However, my answer to these and many similar questions when it comes to industry benchmarks is that you can’t solely look at benchmarks to declare your organization’s successes and failures. Definitely review these benchmarks and consider them as data points, but not as the law of your organization’s digital fundraising performance.
Though the data of many nonprofits are included in these reports, each nonprofit is unique in its creative (i.e. copywriting, images, and offer), donor demographics, and data hygiene. Therefore, it’s important to look at these benchmarks and consider establishing and creating a benchmark report for your own organization, based on your own data. This will provide insight to fuel a better digital strategy for your nonprofit because the data used is as close to the source as it gets, your very own donors.
www.DigitalFundraisingBlueprint.com
To learn more about Digital Fundraising, pick up my best-selling book, “The Digital Fundraising Blueprint” from Amazon
Don't miss a beat!
New nonprofit fundraising and marketing tips + personal development delivered to your inbox.
I hate SPAM. I will never sell your information, for any reason.

